Ultimate Guide to AI Analytics for Outreach
AI analytics is changing how outreach works. Instead of relying on guesswork or outdated metrics, it uses data to show exactly what drives engagement. Here’s what you need to know:
- Precision over volume: AI identifies what messaging works best, saving time and improving results.
- Better targeting: By analyzing historical data, AI predicts which prospects are most likely to respond, boosting reply rates from 3-5% to 15-25%.
- Real-time adjustments: AI tools catch issues like high bounce rates early, allowing you to fix campaigns while they run.
- Key metrics to track: Focus on meaningful KPIs like Positive Reply Rate and pipeline generated per 1,000 contacts instead of vanity metrics like open rates.
- Dashboards that work: AI-powered dashboards turn complex data into actionable insights, helping teams make smarter decisions faster.
AI doesn’t replace your judgment – it enhances it. By combining AI insights with human expertise, you can save time, improve targeting, and achieve better results in outreach.
Key Metrics That Drive Outreach Success
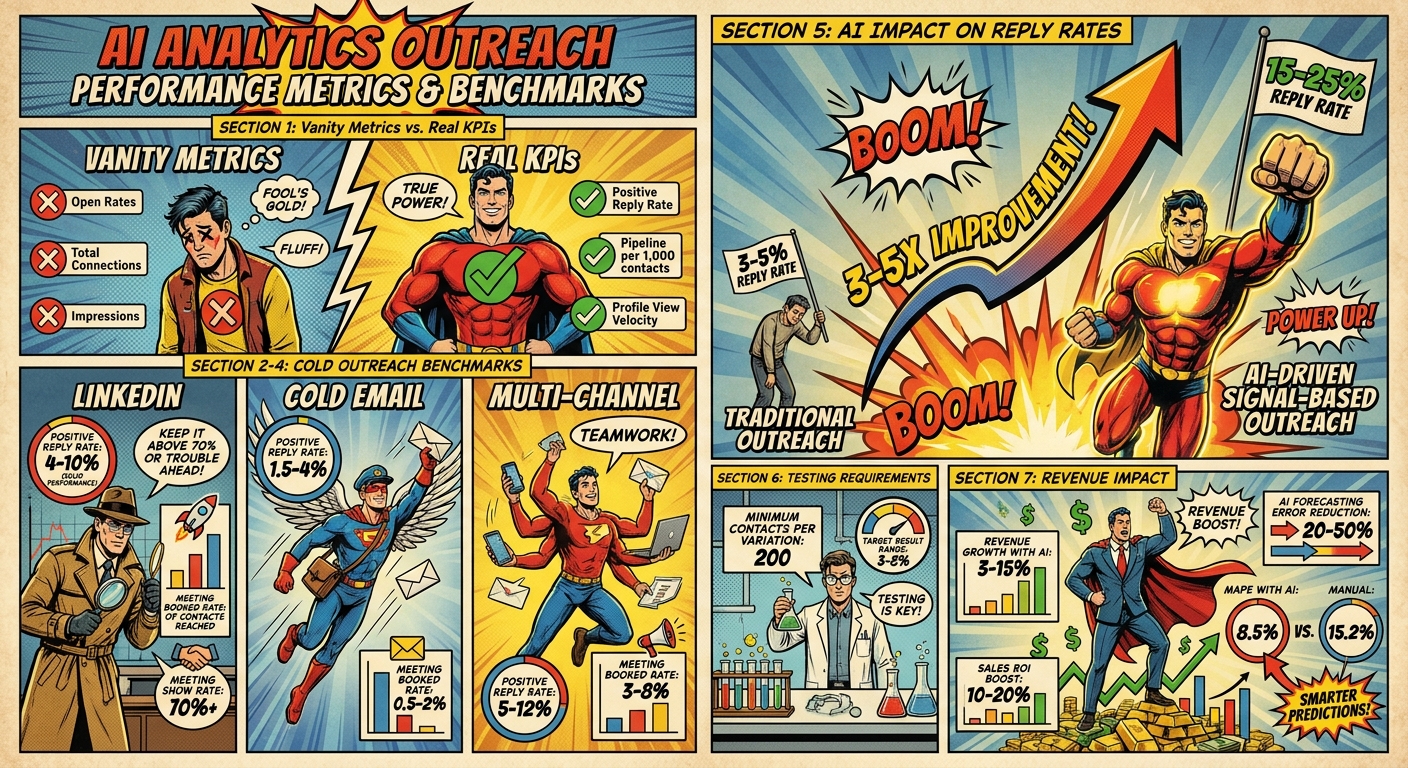
AI Analytics Outreach Performance Metrics and Benchmarks
When it comes to outreach, tracking the right metrics can mean the difference between spinning your wheels and driving real business results. Too often, people focus on vanity metrics – like open rates, total connections, or impressions – that look good but don’t actually move the needle. Thanks to AI-powered analytics, you can shift your attention to metrics that truly matter, focusing on outcomes rather than surface-level activity.
Moving from Vanity Metrics to Real KPIs
Metrics like open rates have become unreliable due to preloaded tracking pixels, and counting raw replies can be misleading if those replies include unsubscribe requests. This is where sentiment analysis comes in, helping you hone in on the Positive Reply Rate – a metric that measures genuine interest, not just any response.
"Reply rate tells you one thing: whether your message got a reaction. It tells you nothing about whether that reaction turns into a meeting, a qualified opportunity, or closed revenue."
- Outzeach Team
Outcome-focused metrics are where the real insights lie. For example, tracking the pipeline generated per 1,000 contacts reached ties your outreach efforts directly to revenue. Another powerful metric is Profile View Velocity – how quickly a prospect checks out your LinkedIn profile after receiving a message. If someone views your profile twice within 24 hours, it’s a strong indicator they’re seriously considering your solution. These micro-metrics capture subtle behavioral cues that traditional analytics often miss.
For LinkedIn cold outreach, a Positive Reply Rate between 4–10% is considered solid, with Meeting Booked Rates ranging from 2–6% of contacts reached. Cold email campaigns typically see lower rates – 1.5–4% for positive replies and 0.5–2% for booked meetings – but using multiple channels can boost these numbers to 5–12% and 3–8%, respectively. If your Meeting Show Rate drops below 70%, it could signal problems with your qualification process or confirmation sequence.
Ready to leave the job you hate and find the fastest path to online wealth? Learn the best asset you have right now to leverage income and build financial run way in my bestseller "Fire Your Boss." Click here to download the book for free.
But tracking these metrics isn’t enough – you also need to understand how they evolve over time.
Analyzing Performance Trends Over Time
Looking at a single data point only gives you part of the story. Tracking trends over time helps you spot both leading and lagging indicators of performance. Leading indicators – like connection acceptance rates, Step-1 positive replies, and profile view rates – can signal performance changes weeks before they show up in your pipeline. On the other hand, lagging indicators like closed deals and revenue reflect past outcomes.
"If you only look at pipeline at the end of the quarter, you have no time to fix the problems that created it. Leading indicators are your early warning system."
- Outzeach Team
Pay close attention to early warning signs. For instance, if your connection acceptance rate drops for two weeks in a row, it could mean your audience is saturated or your profile needs a refresh. Similarly, a Step-1 positive reply rate below 3% suggests your opening message isn’t hitting the mark. Breaking down your results by job title, company size, or industry can uncover patterns that overall data might obscure. To ensure reliable insights, test each message variation on at least 200 contacts and aim for results in the 3–8% range.
Using AI for Real-Time Campaign Adjustments
AI takes the guesswork out of campaign management by enabling quick, tactical changes while your campaigns are still running. Instead of waiting until the end of a quarter to discover that your strategy missed the mark, AI systems identify issues in days and provide actionable recommendations. This means you can pivot fast, making adjustments that improve performance on the fly.
Making Campaign Changes in Real Time
AI tools excel at monitoring multiple performance indicators simultaneously, catching problems before they snowball. For instance, if your bounce rate suddenly spikes or your email placement drops, AI can pause your campaign automatically to protect your sender reputation. This is a game-changer for preserving your contact list and ensuring your emails land where they’re supposed to.
Beyond troubleshooting, AI simplifies response management. It categorizes incoming replies into buckets like "interested", "objections", or "unqualified". This means you can focus on high-value opportunities instead of wasting time on dead ends. Some platforms even perform weekly audits, flagging things like weak subject lines or poorly timed sends.
Take AiSDR’s outreach campaign as an example: by acting on behavioral signals in real time, they targeted 28 leads, achieved a 14.29% reply rate, and booked three meetings – all within just 14 days.
Using Predictive Data for Better Decisions
Real-time adjustments don’t just fix immediate issues – they lay the groundwork for smarter, forward-looking decisions. Predictive analytics takes this a step further, helping you anticipate challenges before they become problems. For example, AI-powered deal health scores can predict outcomes with up to 81% accuracy by analyzing patterns from millions of past deals. If a deal’s health score drops – maybe due to two weeks of silence from stakeholders or a competitor mention in the last call – you can act quickly, reallocating resources or initiating follow-up outreach.
The numbers speak for themselves: businesses using AI in sales and marketing report revenue growth of 3% to 15% and a 10% to 20% boost in sales ROI. AI-powered forecasting also significantly reduces errors – by as much as 20-50% compared to traditional methods. For instance, some systems achieve a Mean Absolute Percentage Error (MAPE) of just 8.5%, compared to 15.2% for manual approaches. Siemens provides a compelling example: in 2026, they implemented AI-driven forecasting for over 4,000 sellers across 190 countries. This not only pushed forecast submission rates above 70% but also gave leadership unparalleled visibility into deal structures.
"With Outreach we get increased transparency. Now we are getting much easier, deeper insights into the structure in a way we’ve never had before."
- Thorsten Reichenberger, Head of Revenue Operations, Siemens
The best results come from combining AI’s predictive power with human expertise. AI highlights the data – like conversation snippets, engagement gaps, or shifting behaviors – but it’s up to you to interpret the context and decide the next move. For example, if a deal score drops below a set threshold, you can flag it for review or tweak your outreach cadence. This approach isn’t just about reacting to data; it’s about staying ahead of it.
Building and Using AI-Powered Dashboards
AI-powered dashboards take complex data and turn it into clear, actionable insights. They don’t just show you what’s happened – they help you predict what’s coming next. When designed thoughtfully, these dashboards don’t just sit idle; they become tools your team actively uses to make smarter, faster decisions.
What to Include in Your Dashboard
Start with predictive deal intelligence. Your dashboard should highlight AI-predicted deal outcomes, confidence scores, and risks tied to specific opportunities. This allows you to spot deals at risk of stalling before they become a problem. Another must-have? Buyer sentiment tracking. Instead of relying on generic metrics like open rates, focus on how prospects truly feel about your outreach.
It’s also important to compare the effectiveness of AI-generated content versus human-written efforts. Use filters to track metrics like delivery rates, opens, clicks, and replies for both types of content. To make it easy for your team to see what’s working, color-code your dashboard to differentiate between fully AI-generated, AI-assisted, and human-only content. Want even more transparency? Add interactive tooltips that show the exact data sources – like LinkedIn profiles or financial filings – that the AI used for personalization.
Another key feature is pipeline velocity tracking. AI can monitor how quickly deals move through each stage and recommend your next steps based on buyer engagement patterns. Since sales reps spend only about 28% of their time actively selling, dashboards that automate data tracking and provide clear action items free up time for what really matters – closing deals.
Tailoring Dashboards to Your Objectives
The best dashboards are designed with their audience in mind. For example, a CEO might need a high-level view of revenue trends, while sales managers benefit from detailed insights into individual rep performance. Focus on metrics that align with your business goals, such as quota attainment, win rates, or account health scores.
You can also create custom saved views for recurring needs, like team rollups or specific sales periods. Use visual tools like spider charts to compare rep performance or bar charts to track revenue growth over time. To simplify performance tracking, include color-coded productivity scores that provide a quick snapshot of how reps are doing.
Before diving into customizations, though, take a hard look at your data. If more than 25% of your input data is unreliable, your AI forecasts won’t be accurate. Make sure your data is not only accurate but also consistent across all platforms in your tech stack.
Finally, set up automated alerts for when key metrics – like engagement rates – drop below critical thresholds. You can also use editing guardrails to ensure changes to templates don’t overwrite historical data, preserving the integrity of your reports. By combining AI’s ability to spot patterns with your team’s judgment, your dashboards become powerful tools for driving action.
These strategies lay the groundwork for using AI analytics to transform your outreach process.
How to Start Using AI Analytics for Outreach
Using AI analytics for outreach doesn’t mean turning your entire process upside down overnight. Instead, think of it as a gradual shift. Start by understanding your current setup, test the waters with small-scale experiments, and then expand based on what delivers results.
Reviewing Your Current Outreach Process
Before diving into AI, take a hard look at your existing data. Why? Because AI builds on the patterns it finds – and if over 25% of your data is unreliable, your forecasts will be off. A good place to start is by applying a data quality framework. This means checking for things like accessibility, accuracy, consistency, and timeliness across your datasets.
Next, make sure your metrics align with your business goals. Are you aiming to bring in new customers, grow revenue, or increase product adoption? Your AI tools should focus on tracking what really matters to those objectives. It’s also critical to standardize definitions across teams. For example, everyone needs to agree on what counts as an "active user" or a "qualified lead." Without this consistency, your AI analysis could lead to unreliable or misleading trends.
Another key step is consolidating your data. If you’re working with multiple tools or platforms, bring everything into one place to avoid errors when comparing performance metrics. Once your data is cleaned up, analyze it to spot trends, gaps, and opportunities. This historical baseline will help you set realistic benchmarks for your AI-driven efforts. Ideally, work with platforms that provide at least 16 months of historical data, as this will give you a clearer picture of long-term performance cycles. Keep in mind that 84% of sales reps missed their quotas last year, so establishing a strong starting point is essential for tracking improvement.
Testing AI Analytics Tools
The best way to start is with a 60-day test period. In the first week, define your ideal customer profile and clean up your data. Over the next two to three weeks, pilot one complete workflow. Stick to your current outreach volume until your pilot achieves a reply rate of over 5%.
Choose your tools based on where your organization stands. You have three main options:
- Augmented AI: Assists your team without taking over.
- Assisted AI: Handles repetitive tasks between touchpoints.
- Autonomous AI: Takes the lead, engaging and qualifying leads on its own.
During the pilot, compare results side by side. Measure open rates, click-through rates, and reply rates for AI-personalized content versus your usual approach. Save any new templates as separate versions to keep your reporting accurate. In the second month, focus on scaling up and ensuring compliance.
Expanding AI-Driven Outreach
Once your pilot shows good results, it’s time to scale – but do it strategically. Shift from generic outreach to signal-based strategies. For instance, tailor your messaging around events like funding announcements, job changes, or shifts in technology use. This approach can boost reply rates from 3-5% to as high as 15-25%, while keeping hard bounce rates under 1% to protect your sender reputation.
Organizations that adjust their KPIs based on AI insights are three times more likely to see better financial outcomes compared to those sticking with traditional metrics. Use AI tools to filter and compare the performance of AI-generated content versus non-AI content during this phase.
Even as you rely more on AI, balance it with human judgment. Let AI handle high-volume tasks like research and initial outreach, but reserve human expertise for more complex conversations and overcoming objections. AI-driven forecasting can cut errors by 20-50%, reducing administrative costs and helping you close more deals. By 2027, it’s expected that 95% of seller research workflows will begin with AI, compared to under 20% in 2024.
This measured expansion ensures your AI outreach efforts stay aligned with your broader goals, while still allowing room for real-time adjustments along the way.
Conclusion: Getting the Most from AI Analytics in Outreach
AI analytics isn’t here to replace your instincts – it’s here to arm you with sharper insights for better decisions. As we’ve seen, blending AI’s accuracy with human expertise creates a winning formula. The numbers back it up: AI-driven forecasting can cut errors by 20% to 50%, and teams using AI have seen revenue growth rates of 83%, compared to 66% for those without it. But here’s the catch – this only works when you combine algorithmic insights with human intuition. As MIT Sloan Management Review puts it:
"The winning combination pairs algorithmic pattern recognition with human judgment about factors that don’t appear in CRM fields".
The first step? Get your data in order. If more than 25% of your input data is unreliable, your analytics will suffer. Once your data foundation is solid, start experimenting. Use comparative reporting to measure how AI-personalized content performs against standard templates. Track metrics like delivery rates, opens, clicks, and replies. This kind of transparency helps you pinpoint where AI is making a difference.
The shift toward AI is already underway. By 2027, 95% of seller research workflows are expected to begin with AI, a huge leap from under 20% in 2024. Companies that adapt their KPIs to reflect AI-driven insights are three times more likely to see financial gains compared to those sticking with traditional metrics. Just look at Siemens – they’ve achieved advanced forecasting and better revenue visibility by embracing AI.
Think of AI as a team member. Set clear KPIs, establish boundaries, and always keep human oversight on the big decisions. Start small – focus on one high-impact workflow, prove its value, and then scale up. By following these steps, you’ll unlock AI’s full potential to elevate your outreach efforts.
FAQs
What’s the fastest way to switch from open rates to real outreach KPIs?
To move beyond open rates and focus on outreach that matters, zero in on metrics that directly influence your sales pipeline and revenue. Metrics like meetings booked, qualified leads, and pipeline progression give a much clearer picture of success. Simply tracking reply rates can be deceptive since they don’t reveal the quality or intent behind the responses.
Instead, leverage AI-powered metrics like click-through rates and engagement levels. These provide deeper insights, helping you fine-tune your messaging and focus on actions that genuinely move the needle.
How much clean historical data do I need for accurate AI predictions?
When it comes to the amount of historical data you need, it really depends on how your business operates and the length of your forecast horizon. The key is to strike a balance. Using too little data can leave out important trends, while relying on too much might bring in outdated patterns or lead to overfitting. The sweet spot lies in selecting data that mirrors current conditions as closely as possible to ensure accurate forecasting.
Which dashboard metrics best predict meetings and pipeline early?
To predict meetings and pipeline performance early, focus on key dashboard metrics that reveal genuine engagement and market response. Metrics like deliverability health, positive reply rates, and cost per meeting provide valuable insight into how well your outreach efforts are landing with your audience.
Beyond that, keep an eye on deal movement – whether by stage or forecast category – to get a clear picture of pipeline progress. Monitoring weekly changes in deal value can also help you understand momentum and spot trends before they impact your bottom line.
Related Blog Posts
- How to Validate Business Ideas Before Quitting Your Job
- AI Tools for Personal Branding and Networking
- How to Build an AI Decision Framework
- AI Personalization for Subscription Models
Ready to leave the job you hate and find the fastest path to online wealth? Learn the best asset you have right now to leverage income and build financial run way in my bestseller "Fire Your Boss." Click here to download the book for free.